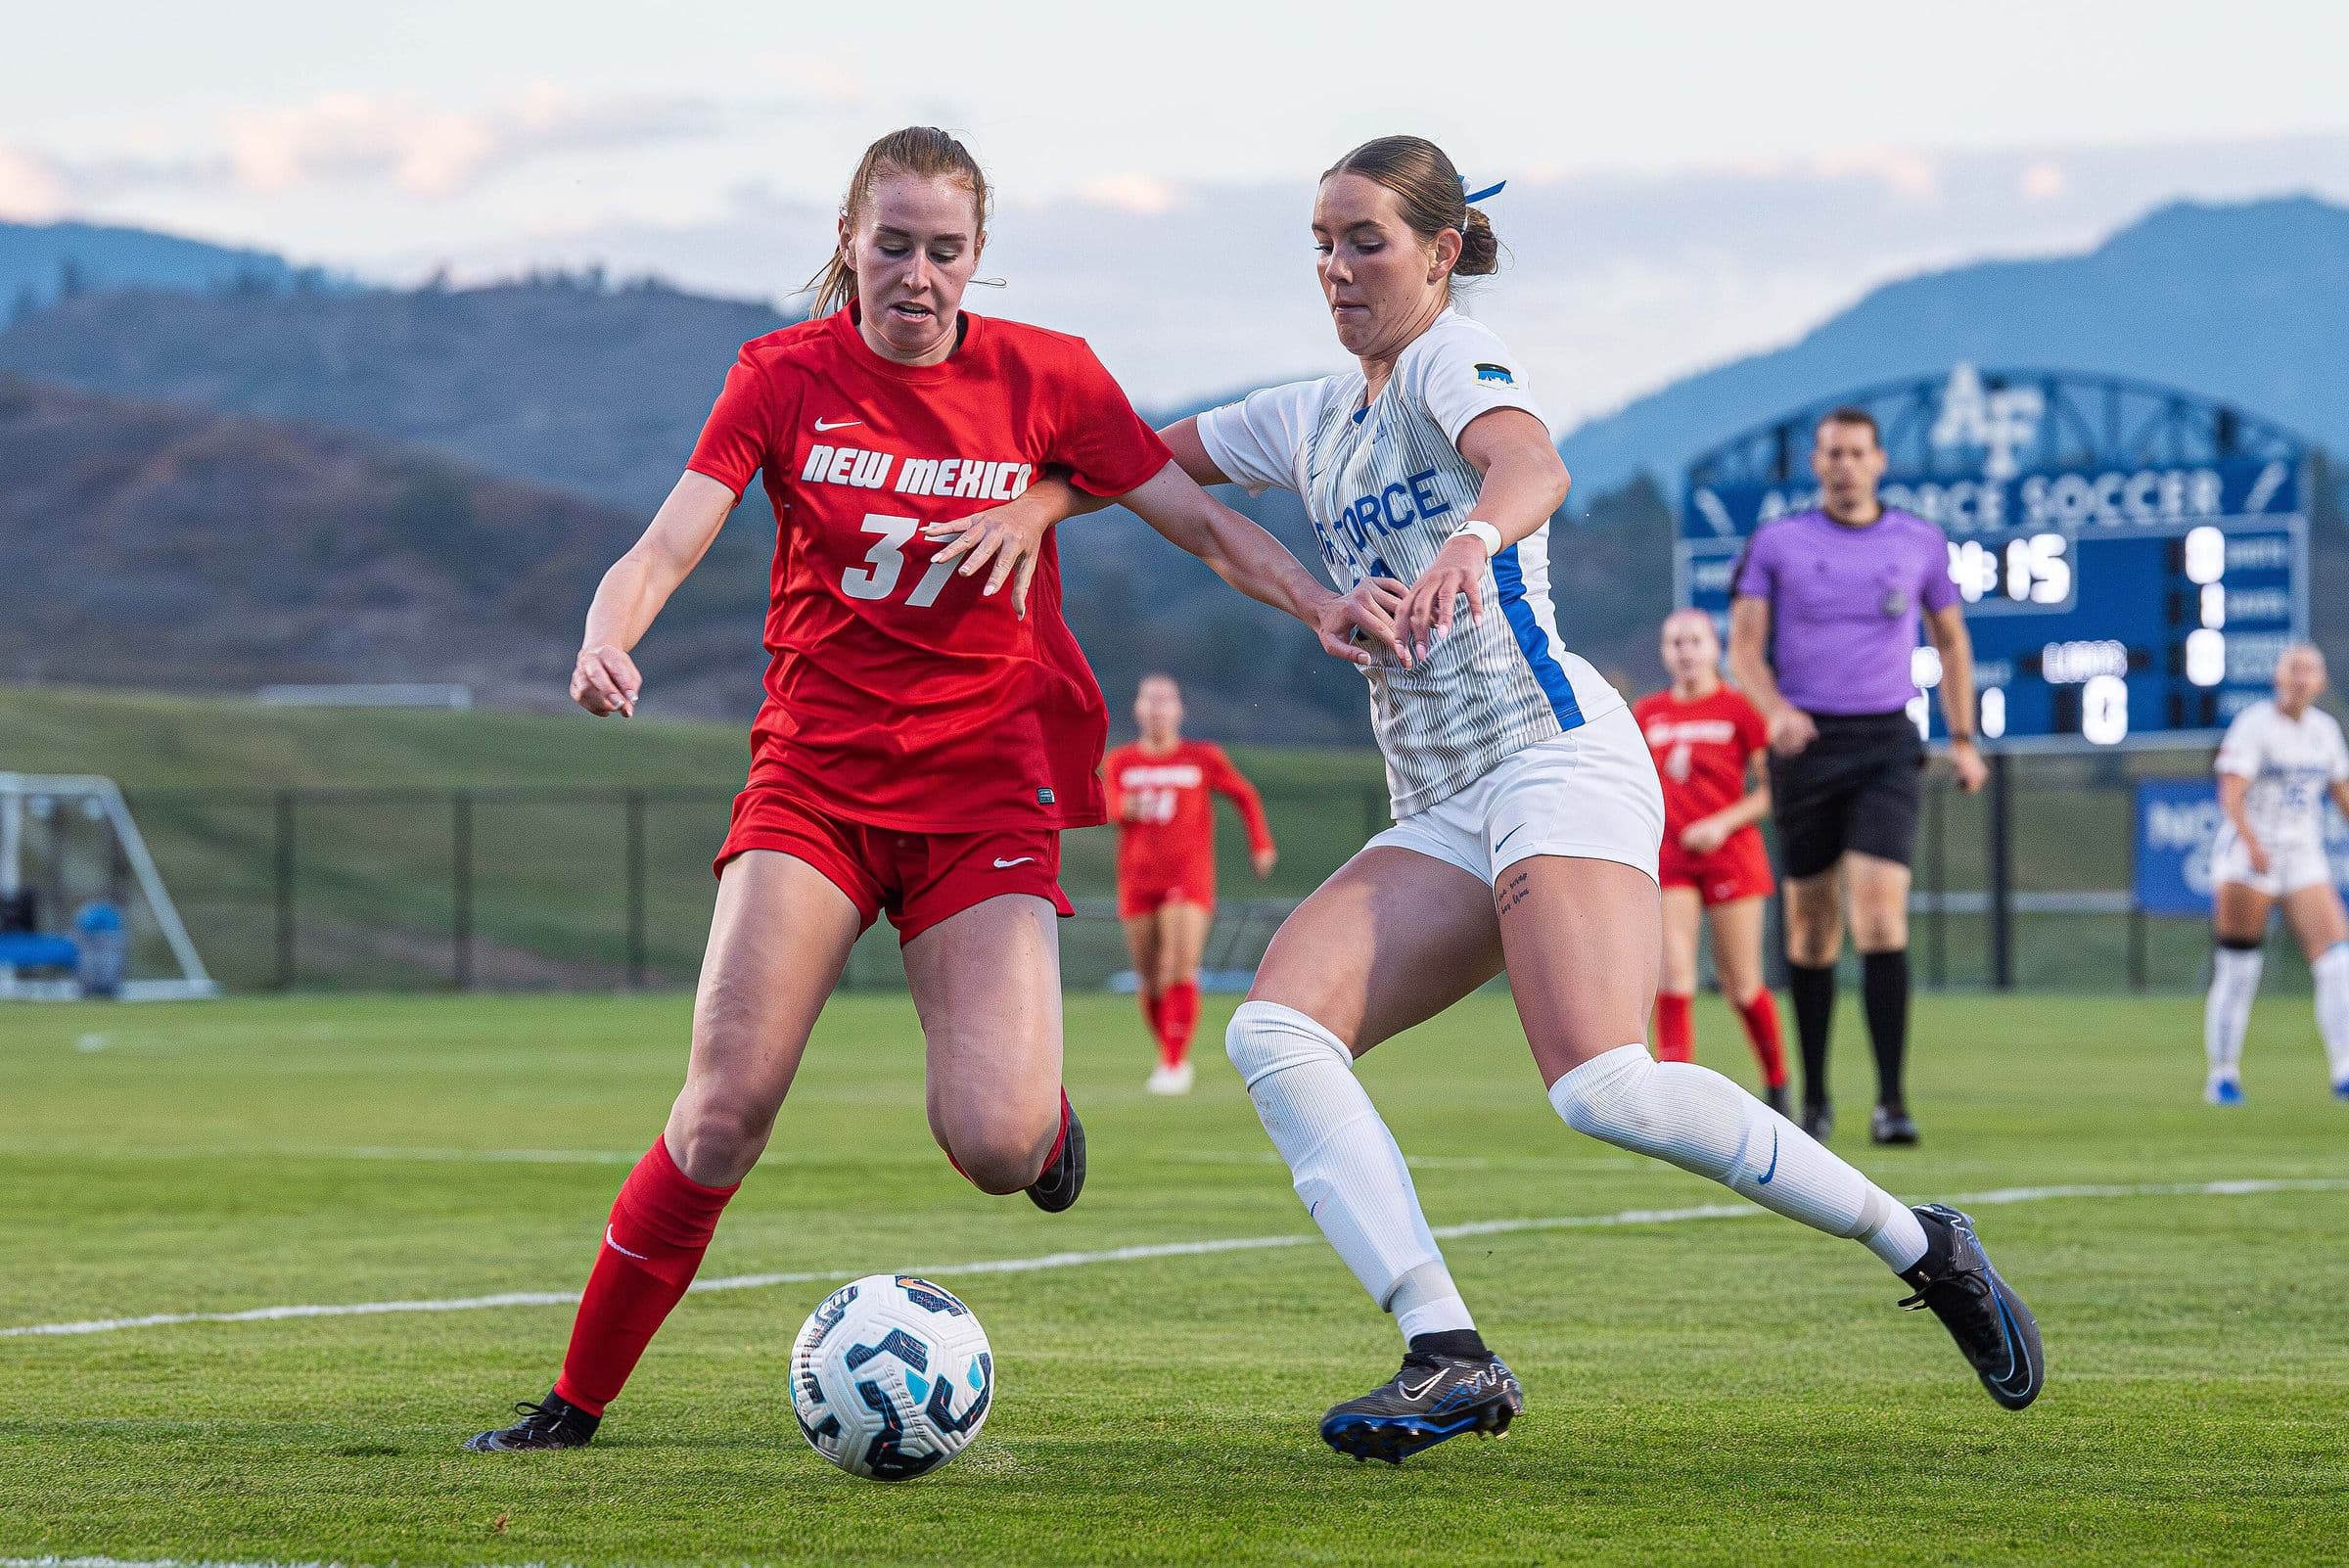
The four levels
D1 vs D2 vs D3 vs NAIA soccer: what is the difference?
The short answer
There are 562 Division I soccer programs, 460 in Division II, 820 in Division III and 373 in the NAIA. Division I and II and the NAIA award athletic scholarships; Division III does not. The levels differ in the size of the school, the money and when coaches may contact a player.
Counted from our data on
| Programs | D1 562 · D2 460 · D3 820 · NAIA 373 |
|---|---|
| Athletic scholarships | D1 yes · D2 yes (up to 9.0 men’s, 9.9 women’s) · D3 none · NAIA yes (up to 12) |
| Division I roster limit | 28 players, at schools in the House settlement (Bylaw 17.2) |
| Coaches may call or message | D1 from June 15 after sophomore year · D2 at any time · D3 at any time · NAIA no set start date |
| Median graduation rate of the schools | D1 68% · D2 53% · D3 64% · NAIA 44% |
How many D1, D2, D3 and NAIA soccer programs are there?
| Level | Women’s programs | Men’s programs | Median roster, women | Median roster, men |
|---|---|---|---|---|
| D1 | Women’s programs349 | Men’s programs213 | Median roster, women28 | Median roster, men28 |
| D2 | Women’s programs259 | Men’s programs201 | Median roster, women30 | Median roster, men33 |
| D3 | Women’s programs415 | Men’s programs405 | Median roster, women28 | Median roster, men32 |
| NAIA | Women’s programs189 | Men’s programs184 | Median roster, women25 | Median roster, men32 |
Roster size is the number of players each school lists for 2026-27, where the page confirms the season.
The largest level is Division III, with 820 programs; the smallest is the NAIA, with 373. Browse each level: D1, D2, D3, NAIA.
Which levels give soccer scholarships?
| Level | Athletic aid | The limit | Source |
|---|---|---|---|
| Division I | Athletic aidYes | The limitA roster of at most 28 at schools in the House settlement | SourceBylaw 17.2 |
| Division II | Athletic aidYes, usually partial | The limitThe value of 9.0 full scholarships (men), 9.9 (women), shared across the squad | SourceBylaw 15.4.2.1.1; Bylaw 15.4.2.1.2 |
| Division III | Athletic aidNone | The limitnone: aid may not be based on athletics ability or participation | SourceBylaw 15.01.3 |
| NAIA | Athletic aidYes, usually partial | The limitThe value of 12 full scholarships, shared across the squad | SourceNAIA Handbook, financial aid policy |
Across all sports, the NCAA reports that 70% of Division I athletes and 77% of Division II athletes receive athletics aid, and that 80% of Division III athletes receive aid that is not athletic. A limit is a ceiling, not what a program has: many do not fund up to it. More in college soccer scholarships.
How do the schools themselves differ?
| Level | Median enrollment | Public / private | Median tuition (2023-24) | Median graduation rate |
|---|---|---|---|---|
| D1 | Median enrollment9,014 | Public / private227 / 123 | Median tuition (2023-24)$32,193 | Median graduation rate68% |
| D2 | Median enrollment2,508 | Public / private123 / 137 | Median tuition (2023-24)$24,854 | Median graduation rate53% |
| D3 | Median enrollment1,769 | Public / private86 / 334 | Median tuition (2023-24)$39,050 | Median graduation rate64% |
| NAIA | Median enrollment1,065 | Public / private25 / 165 | Median tuition (2023-24)$29,059 | Median graduation rate44% |
One value per school, for the schools that sponsor soccer. Tuition is the published out-of-state price before aid; graduation rate is the six-year rate for all students. Both are what schools report to the US Department of Education.
The NCAA’s own table for all sports gives a median undergraduate enrollment of 8,900 in Division I, 2,100 in Division II and 1,600 in Division III. Private colleges are 334 of 424 of the Division III schools with soccer and 165 of 196 of the NAIA schools; in Division I they are 123 of 350.
When can coaches at each level contact a player?
| Level | Calls and messages | In-person contact off campus | Official visits |
|---|---|---|---|
| Division I | Calls and messagesJune 15 after sophomore year (Bylaws 13.1.3.1 and 13.4.1) | In-person contact off campusAugust 1 before junior year (Bylaw 13.1.1.1) | Official visitsAugust 1 of junior year (Bylaw 13.6.2.1.1) |
| Division II | Calls and messagesat any time (Bylaw 13.1.3.1) | In-person contact off campusJune 15 before junior year (Bylaw 13.1.1.1) | Official visitsJune 15 before junior year (Bylaw 13.3.1.2) |
| Division III | Calls and messagesat any time (Bylaw 13.4.1) | In-person contact off campusafter sophomore year (Bylaw 13.1.1.1) | Official visitsJanuary 1 of junior year (Bylaw 13.6.1.1.1) |
| NAIA | Calls and messagesno set start date | In-person contact off campusno set start date | Official visitsno set start date |
NAIA: the NAIA handbook has no recruiting calendar or dead periods.
Who is on the rosters at each level?
| Level | Median international share, women | Median international share, men | Freshmen, women | Freshmen, men |
|---|---|---|---|---|
| D1 | Median international share, women9% | Median international share, men33% | Freshmen, women27% | Freshmen, men27% |
| D2 | Median international share, women4% | Median international share, men34% | Freshmen, women30% | Freshmen, men30% |
| D3 | Median international share, women0% | Median international share, men4% | Freshmen, women30% | Freshmen, men33% |
| NAIA | Median international share, women9% | Median international share, men52% | Freshmen, women28% | Freshmen, men29% |
International share: the middle roster’s share of players whose listed hometown is outside the United States.
The middle men’s roster is most international in the NAIA (52%) and least in Division III (4%). The women’s figures are in the table beside them. For a player in the United States that changes how many places on a roster are really open: see how hard it is to play college soccer.
Is D1 better than D2, D3 or NAIA?
A division is a set of rules about money, contact and school size. It is not a ranking of every team inside it. For one player, the better program is the one where they can make the squad, play, afford the school and want the degree. Our lists of the best D1 soccer schools and the best D3 soccer schools order programs by results, so you can see where one team sits inside its own level.
Quick answers
- What is the difference between D1, D2 and D3 soccer?
- Division I has the largest schools and budgets and 562 soccer programs. Division II has 460 programs and usually partial scholarships. Division III has 820 programs and no athletic scholarships; aid there is academic or need-based.
- Is NAIA better than D3?
- Neither is better as a whole. The NAIA awards athletic scholarships and Division III does not. Division III has 820 soccer programs and the NAIA has 373, so there are more Division III rosters to look at.
- Can D3 schools give soccer scholarships?
- Not athletic ones. The Division III Manual says aid may not be awarded on the basis of athletics ability or participation (Bylaw 15.01.3). Division III players receive academic and need-based aid.
- Is D2 soccer good?
- Division II programs may award the value of 9.0 full scholarships on the men’s side and 9.9 on the women’s, and the middle Division II men’s roster is 34% international, so those programs recruit well beyond their own state.
- Which division should I aim for?
- More than one. Build a list with programs at two or three levels where your ability, grades and budget fit, then let the answers from coaches narrow it.
How this was counted
Program counts are our directory of every NCAA and NAIA soccer program. Roster figures are counted from each school’s own 2026-27 roster page where the page confirms the season; international share uses rosters with at least eight placed hometowns. School figures are IPEDS data, one value per school. Rules are quoted from each association’s current manual.
Sources
- NCAA Guide for the College-Bound Student-Athlete, 2026-27 ↗
- NCAA Division I Manual, 2026-27 (Legislative Services Database) ↗
- NCAA Division II Manual, 2026-27 (Legislative Services Database) ↗
- NCAA Division III Manual, 2026-27 (Legislative Services Database) ↗
- NAIA Official Handbook, 2026-2027 ↗
- Startline: programs, rosters, enrollment, tuition and graduation rates for every school that sponsors soccer
Last checked against these sources on. Figures marked Startline are counted from the data we hold and move when it does. Rules change: check anything dated against the governing body itself.
Compare programs across levels for a sample player
The demo’s compare screen puts a Division I, II and III program side by side for a sample player.
The demo is the real product with a sample player in it. No account, no card, and nothing you do in it is charged or sent.